Why transformers, switchgear, substations, UPS systems and power conversion may determine how fast AI data centers can scale
The Power Infrastructure Behind AI That Investors Are Just Beginning to Notice
Executive Summary
CENTRAL INVESTOR QUESTION. Are transformers, substations, switchgear, UPS systems and power-conversion equipment becoming the practical bottlenecks that determine how much AI compute can actually be energized and deployed?
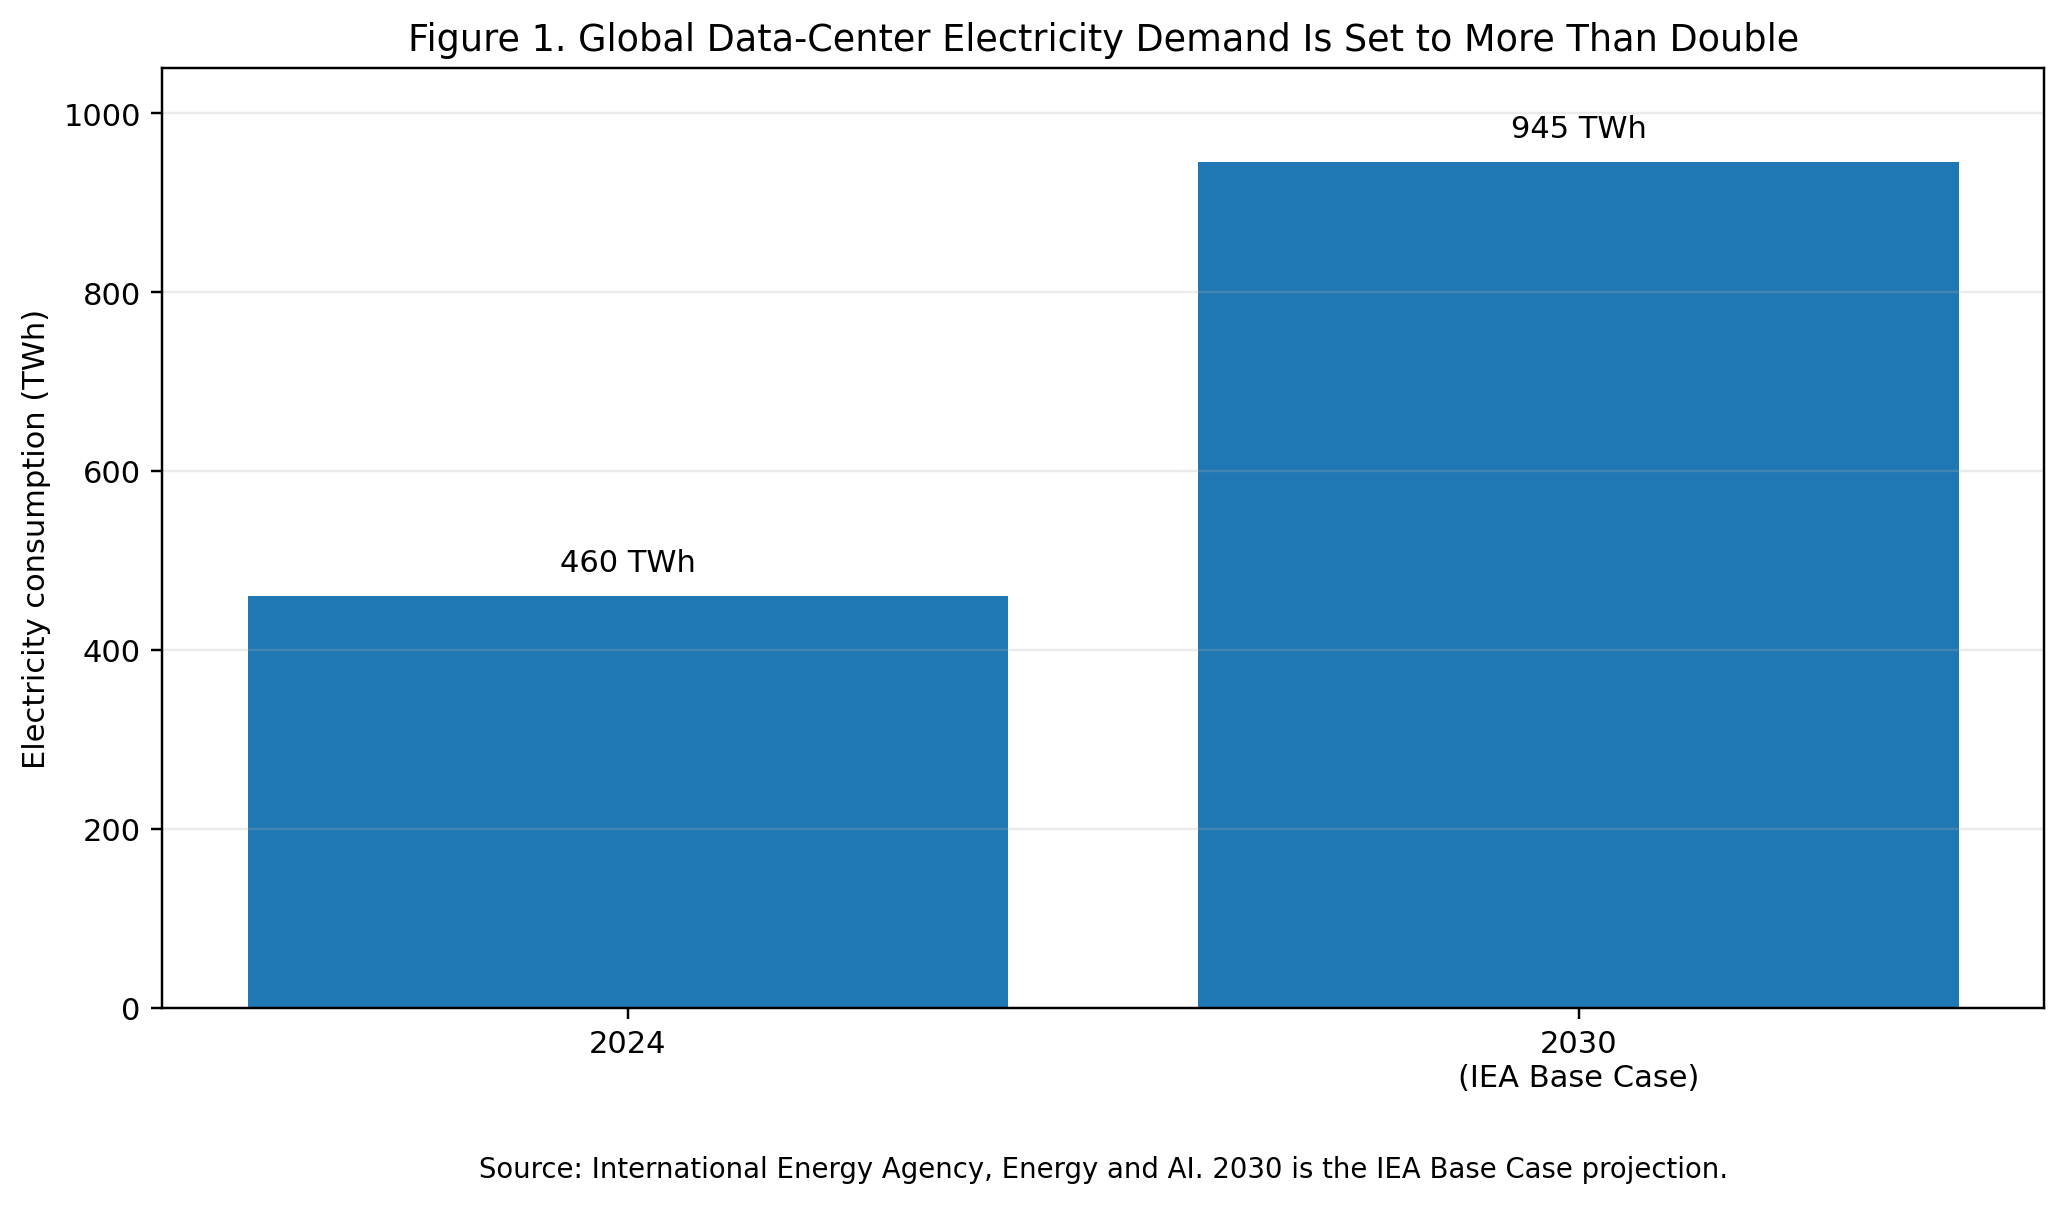
AI infrastructure is usually measured in GPUs, but deployable compute is increasingly constrained by the ability to deliver reliable megawatts. The International Energy Agency projects global data-center electricity consumption rising from about 460 TWh in 2024 to 945 TWh by 2030 in its Base Case, while data centers are expected to account for nearly half of U.S. electricity-demand growth through 2030 [1]. The result is a growing mismatch between digital investment cycles and the slower industrial cycles of grid interconnection, substations and electrical equipment.
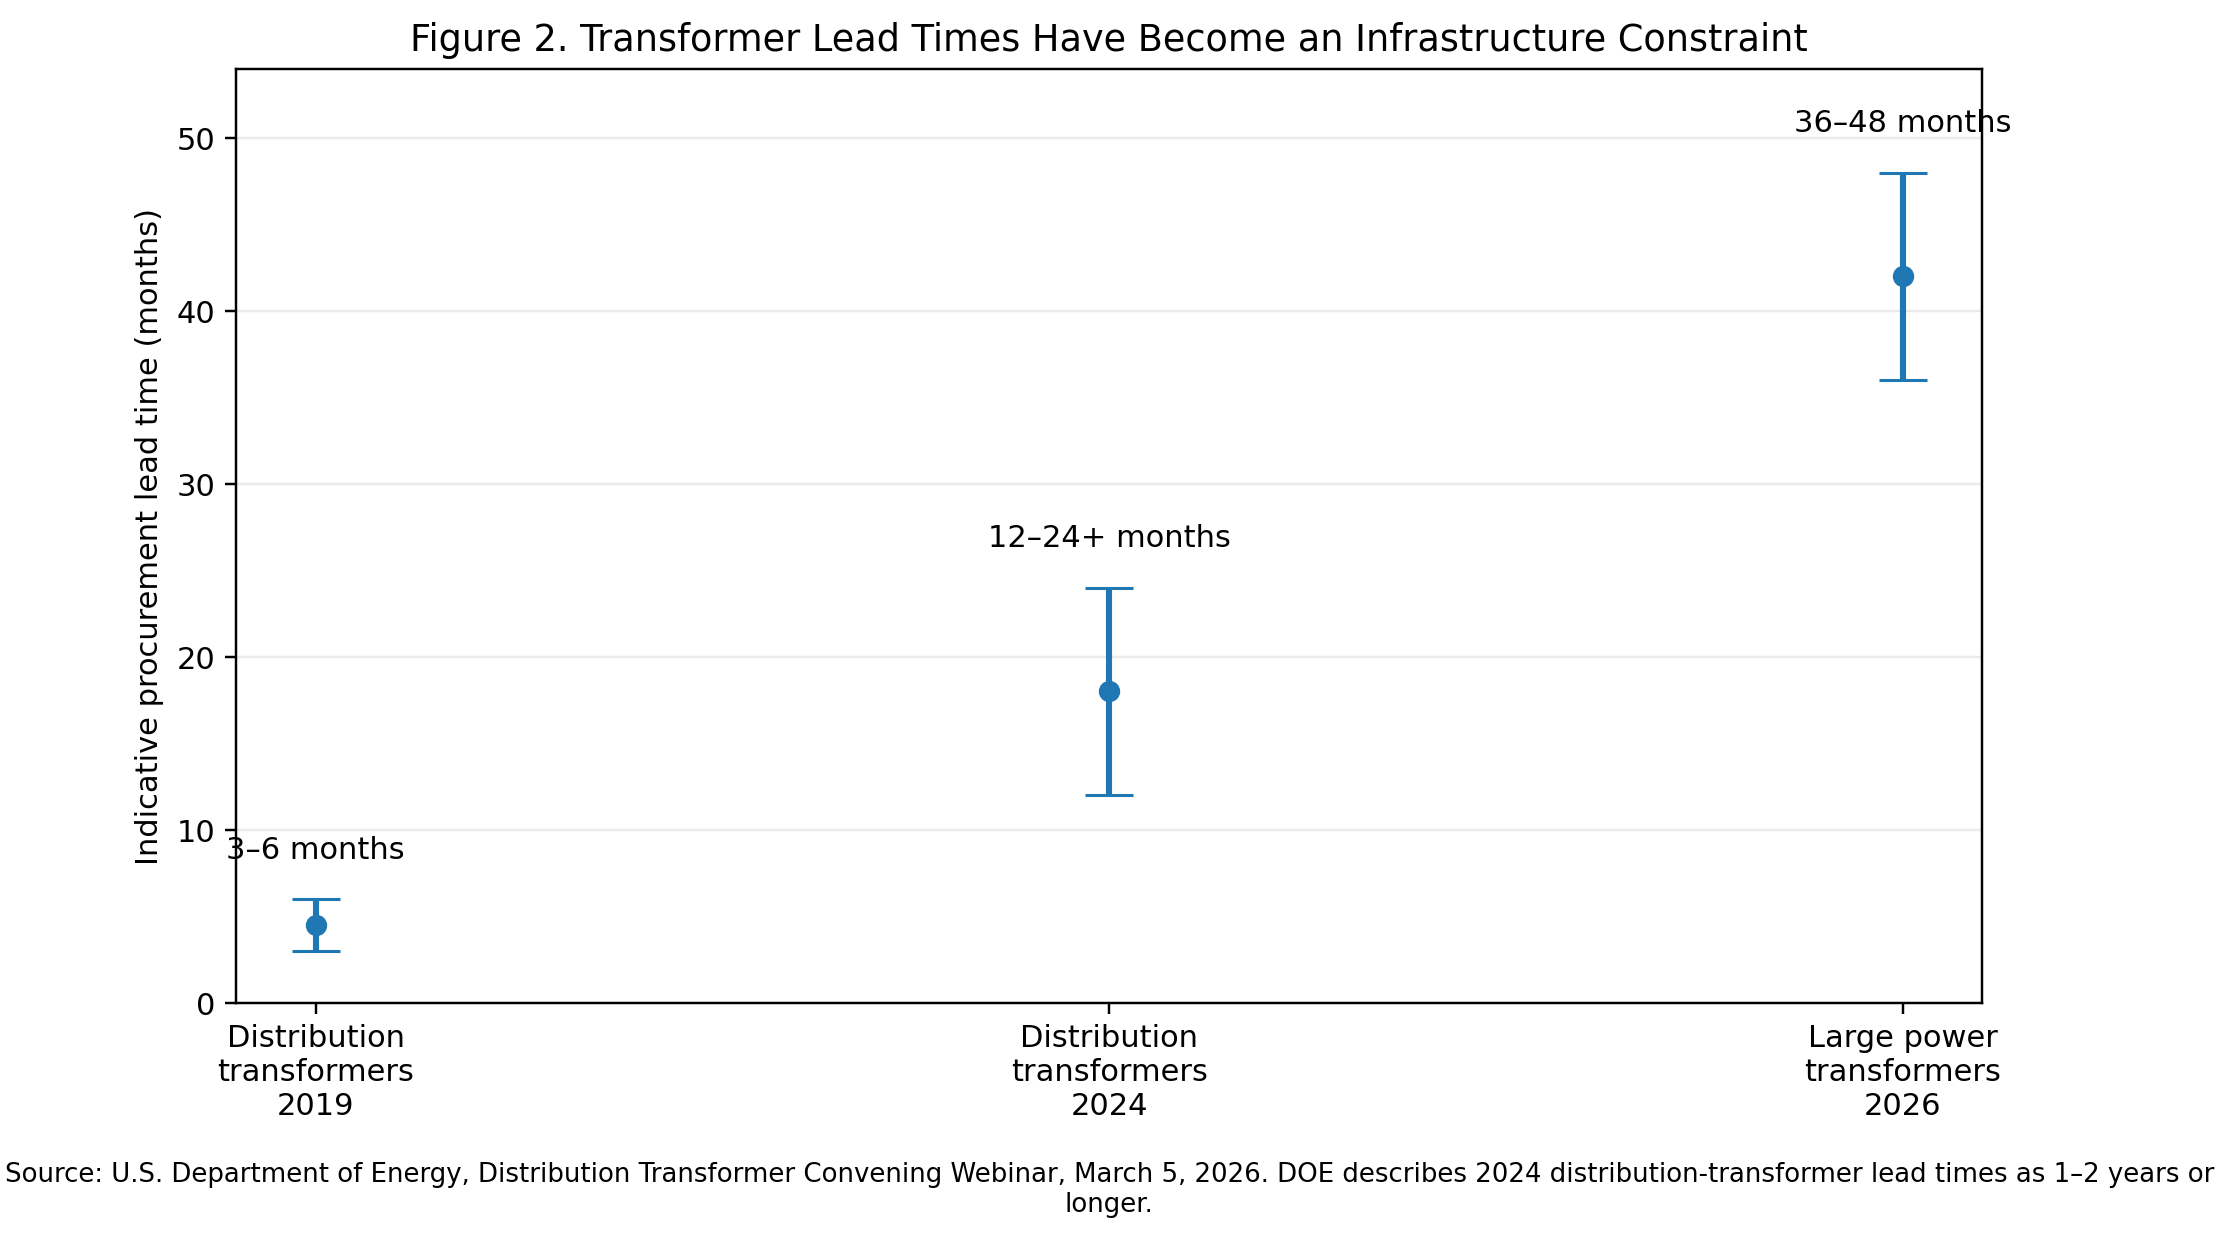
The transformer is the clearest example. U.S. Department of Energy data show distribution-transformer demand up 41% since 2019. Typical lead times have moved from roughly 3-6 months in 2019 to one to two years or longer, while large power transformers can require three to four years [2]. These constraints can delay a project even when land, financing, construction capacity and accelerators are available.
Key Findings
| Demand shock | IEA Base Case: data-center electricity use increases from ~460 TWh in 2024 to 945 TWh in 2030 [1]. |
| Long-lead hardware | Distribution transformers can require 12-24+ months; large power transformers 36-48 months [2]. |
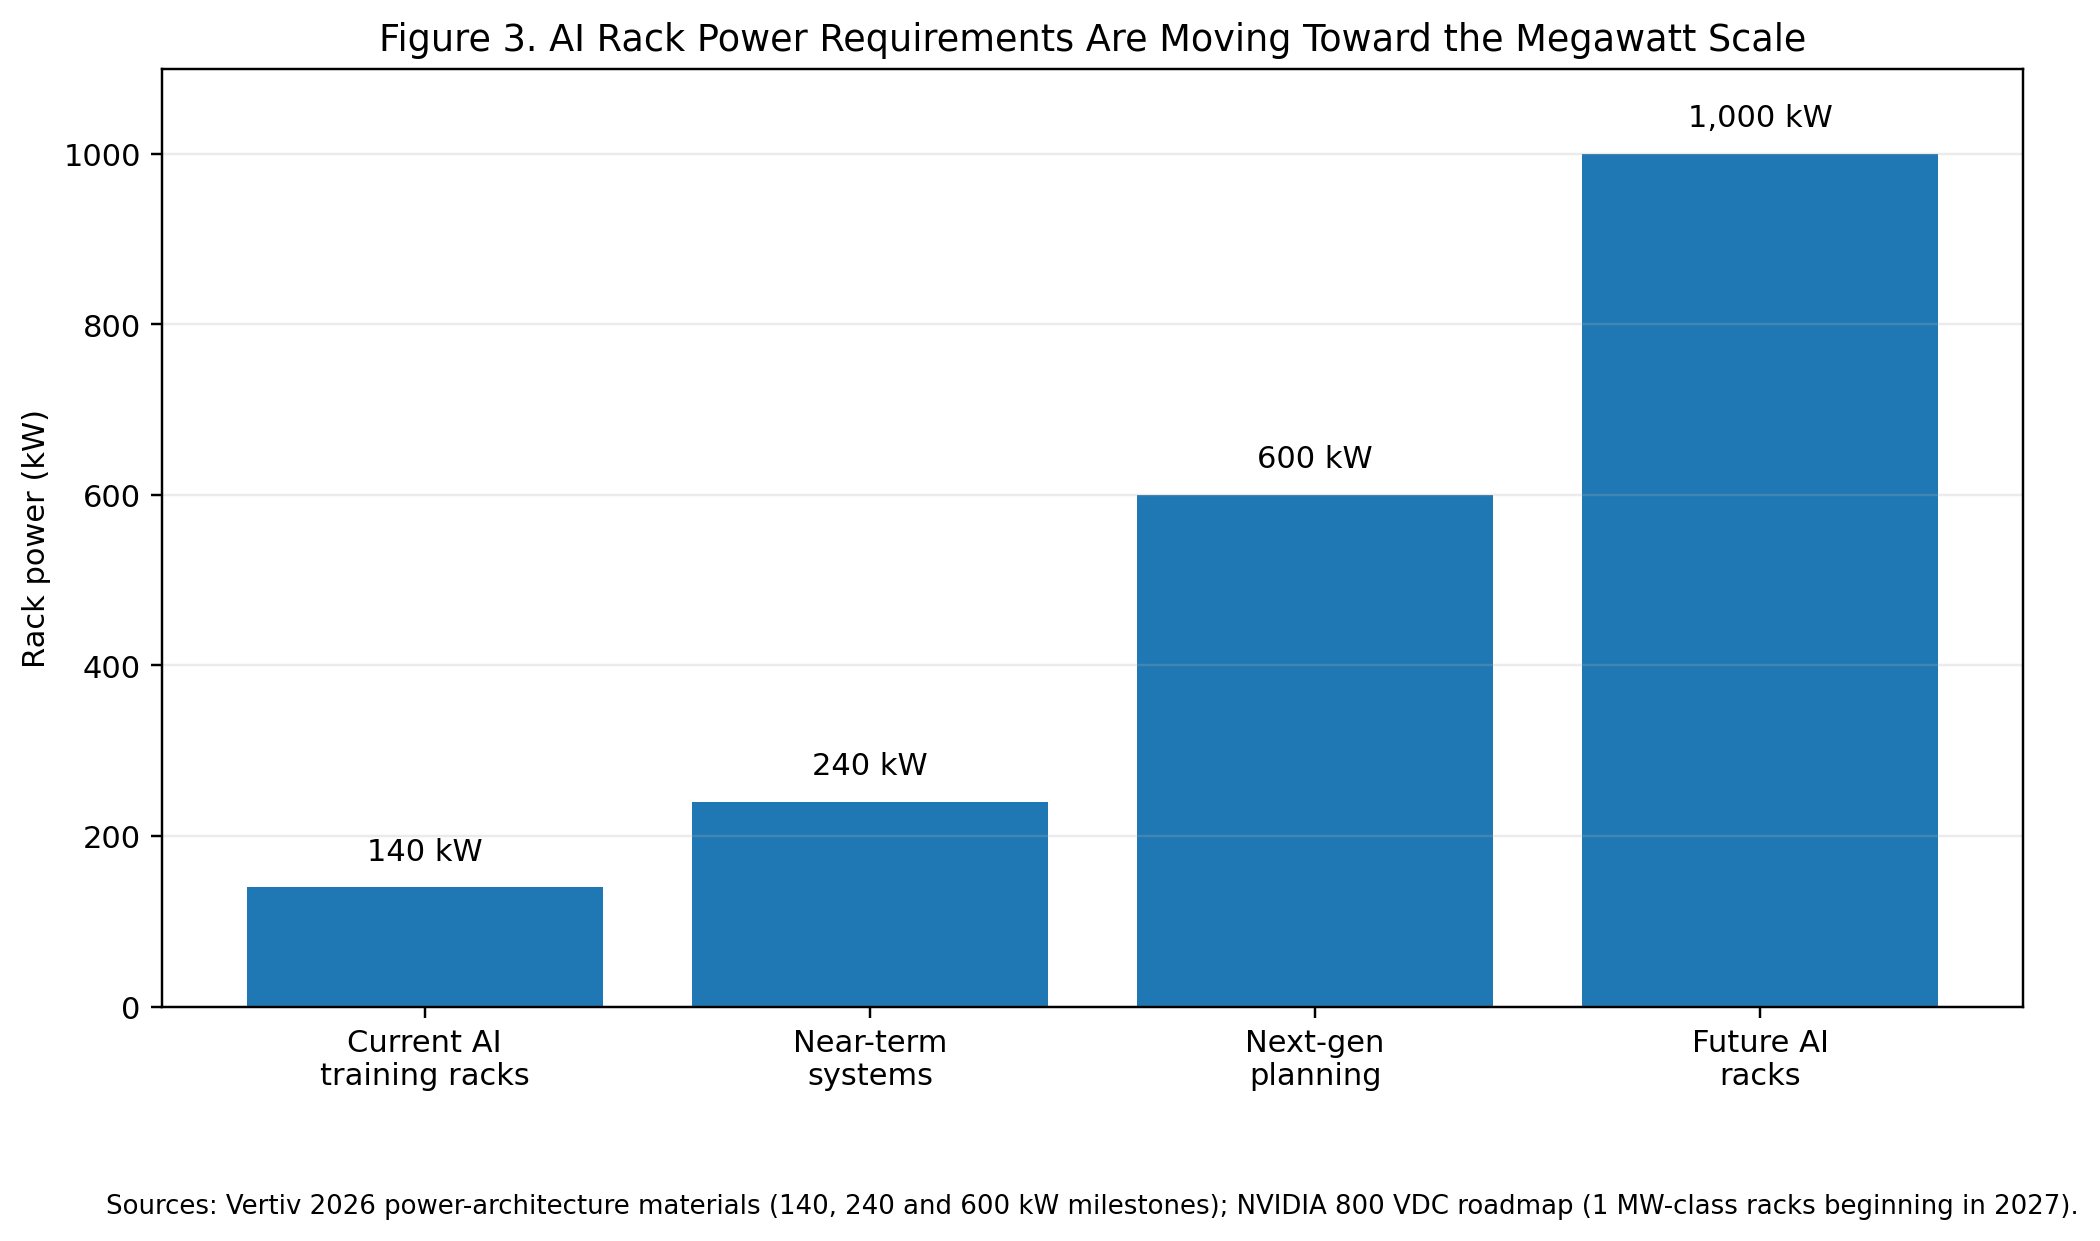
| Rack-density escalation | Industry planning is moving from ~140 kW AI racks toward 600 kW and 1 MW-class architectures [8][9]. |
| Corporate confirmation | Eaton, Vertiv, Schneider Electric and GE Vernova all reported strong 2026 data-center/electrification demand [4]-[7]. |
Strategic Implication
For investors, the relevant unit is no longer simply compute capacity ordered. It is compute capacity that can be energized on schedule. That shifts attention toward time-to-power, grid interconnection, electrical-equipment backlogs, power-conversion efficiency, rack density and the suppliers that reduce deployment time or increase useful AI output per contracted megawatt.
1. The Bottleneck Is Migrating From Compute to Power
A rack full of accelerators is not productive AI infrastructure until electricity can reach it at the right voltage, quality and reliability. The IEA projects global data-center electricity consumption rising from roughly 460 TWh in 2024 to 945 TWh by 2030 in its Base Case [1]. The agency also highlights a timing mismatch: a data center can be built in roughly two to three years, while the wider energy system often requires longer planning, permitting and construction cycles.
Time to power is becoming a financial metric
The most revealing bottleneck is the transformer. DOE data show demand for distribution transformers has increased 41% since 2019. Lead times rose from approximately 3-6 months in 2019 to one to two years or longer in 2024; large power transformers serving substations and generation projects can require three to four years [2]. Unlike accelerators, transformers depend on heavy industrial capacity, specialized electrical steel, copper, high-voltage insulation and extensive factory testing. Capacity therefore cannot be expanded at software speed.
Transformers are only one gate. New AI campuses may also require transmission upgrades, utility interconnection, substations, medium-voltage switchgear, protection systems, backup generation or batteries, UPS systems and multiple conversion stages before electricity reaches the rack. A delay at any stage can strand capital already committed to land, buildings, cooling and servers.
2. AI Is Rewriting the Grid-to-Rack Power Architecture
The power constraint is moving inside the data center as well. Vertiv materials describe current AI-training racks around 140 kW, near-term systems around 240 kW and planning scenarios near 600 kW [9]. NVIDIA has proposed an 800 VDC architecture for 1 MW-class IT racks beginning in 2027 [8]. At those densities, conventional low-voltage distribution drives higher current, heavier copper, larger busbars, more conversion hardware and greater heat losses.
Why higher-voltage architectures matter
NVIDIA states that its proposed 800 VDC design can transmit 85% more power through the same conductor size while reducing copper requirements by 45% relative to a 415 VAC architecture [8]. Those are vendor engineering estimates rather than universal performance guarantees, but the direction is important: as rack density rises, power distribution and conversion become design variables that affect floor space, copper use, thermal load and total cost of ownership.
INVESTOR LENS. A 1-2% efficiency gain becomes economically meaningful when applied continuously across hundreds of megawatts. The power stack therefore creates room for value capture in conversion semiconductors, UPS, DC distribution, busways, protection, batteries and controls – not only in utility-scale equipment.
3. Corporate Results Confirm the Spending Shift
| Company | 2026 signal | Why it matters |
|---|---|---|
| Eaton | Electrical Americas Q2 sales $4.0B; rolling orders +41%; total Electrical-sector backlog +43% YoY [4]. | Switchgear, breakers and distribution. |
| Vertiv | Q2 sales $3.274B, +24% YoY; FY2026 sales guidance about $14B at midpoint [5]. | UPS, power distribution, cooling and integrated infrastructure. |
| Schneider Electric | Q2 revenue EUR11.5B, +17% organic; Energy Management +18%; growth led by data centers [6]. | Medium-voltage systems, switchgear and energy management. |
| GE Vernova | Q2 orders $24.2B, +88% organic; backlog $176B; data-center Electrification orders >$5B YTD [7]. | Transformers, substations and grid integration. |
4. How the Constraint Can Be Relieved
The answer is unlikely to be a single technology. The bottleneck will be eased by parallel improvements in manufacturing capacity, specification standardization, modular construction, grid flexibility and higher-efficiency power architectures.
| Bottleneck | Near-term response | Innovation opportunity |
|---|---|---|
| Transformer manufacturing | Expand domestic capacity; order long-lead equipment earlier. | Advanced magnetic materials, automated winding/testing, modular transformer designs. |
| Specification fragmentation | Use standardized utility specifications and interchangeable configurations. | Configurable platforms and digital engineering that reduce custom design cycles. |
| Substation / switchgear delivery | Prefabricated substations and parallel construction. | Digital switchgear, solid-state protection, arc detection and predictive diagnostics. |
| Rack power conversion | Move conversion outside the rack; use higher-voltage distribution where justified. | 800 VDC, SiC/GaN conversion, solid-state transformers and DC protection. |
| Grid interconnection | Combine utility supply with batteries, microgrids or onsite generation. | Grid-interactive UPS/BESS, workload-aware orchestration and microgrid controls. |
Standardization may be an underrated lever
DOE has identified more than 80,000 distribution-transformer varieties nationwide [3]. Utility-specific designs and legacy specifications make production more difficult to standardize and automate. Reducing unnecessary variation could shorten engineering cycles, simplify inventories and improve factory throughput without requiring every solution to come from new capacity. Modular substations and factory-built electrical blocks offer a similar logic by shifting work from constrained construction sites toward repeatable manufacturing environments.
Where innovation value may emerge
The highest-leverage opportunities may be technologies that increase productive compute per contracted megawatt or shorten time-to-power. Candidates include high-efficiency silicon-carbide and gallium-nitride conversion, solid-state transformers, medium-voltage DC, grid-interactive UPS systems, advanced batteries, modular substations, digital protection, transformer-condition sensors, electrical digital twins and microgrid controls. Power-management software may also become more valuable as operators coordinate workloads with grid conditions and onsite energy resources.
This power-infrastructure thesis is distinct from the HBM and advanced-packaging bottlenecks. Memory constrains how quickly accelerators can be fed with data; packaging constrains how chips and HBM are integrated. Here, the constraint begins after the accelerator exists: whether enough reliable electrical infrastructure can be built and energized around it. The suppliers, lead times and capital cycles are materially different.
5. Investor Takeaway
AI is exposing the difference between digital scaling and physical infrastructure scaling. GPU performance can improve dramatically within a product generation. Transformers, substations and transmission systems expand on industrial timelines. That mismatch means the next increment of AI capacity may be determined less by whether accelerators can be purchased than by whether a site can secure, transform, protect and distribute enough electricity to operate them.
The metrics worth monitoring therefore extend beyond semiconductor shipments: transformer lead times, utility interconnection queues, electrical-equipment order books, data-center-related backlogs, rack power density, adoption of higher-voltage architectures and the share of capital spending directed to substations and power systems. As power density rises, efficiency and deployment speed become economic variables, not merely engineering details.
CORE STRATEGIC QUESTION. How quickly can reliable megawatts be converted into productive AI compute?
Selected References
1. International Energy Agency, Energy and AI – Energy demand from AI.
2. U.S. Department of Energy, Distribution Transformer Convening Webinar, March 5, 2026.
3. U.S. Department of Energy, Supply Chain and Market Analysis.
4. Eaton, Q2 2026 financial results.
5. Vertiv, Q2 2026 financial results.
6. Schneider Electric, Q2 2026 financial results.
7. GE Vernova, Q2 2026 financial results.
8. NVIDIA, 800 VDC architecture for next-generation AI factories.
9. Vertiv, Power Architecture Transformation / 2026 AI power materials.
10. Schneider Electric, 800 VDC: Powering the Future of AI Data Centers.
Research note: Forecasts are identified as projections. Corporate operating metrics are drawn from company disclosures. Vendor engineering claims regarding 800 VDC architectures are presented as such and should not be interpreted as universal performance guarantees.